No tool will ever save an organization, but situational awareness might. It's the key.
Getting situational awareness in a software project is a hard problem. Even with rapid iterations and quick feedback, we’re focusing mostly on surface behavior or functional correctness.
And when we have code-level metrics, they tend to measure technical details that aren’t easily communicable to non-technical stakeholders; engineering and business need different leading indicators. We don’t speak the same language, but we would need to get the same unbiased view of how our system evolves. It’s crucial.
In this article we learn how to communicate the effects of technical improvements to non-technical stakeholders, and to visualize the business impact of technical debt. We turn to a case study of a project gone wrong to illustrate how we can bridge the communication gap between engineering and business. Let’s start with the main challenge: lack of visibility.
Tech Debt Management - Software Lacks Visibility
If you have ever seen a software project spiral out of control, you will recognize the telltale signs: a mountain of technical debt is accumulated, deadlines fly by as the development organization scrambles to get that critical feature in, and management experiences a constant shortage of programmers, no matter how many more people we hire.
I’ve become convinced that the reason we fail to notice those issues until it’s already too late is because the true root causes lack visibility. Code at scale is opaque. Instead we react to symptoms, and symptoms are often lagging, meaning a delayed feedback loop.
Are we treating symptoms instead of the real issue?
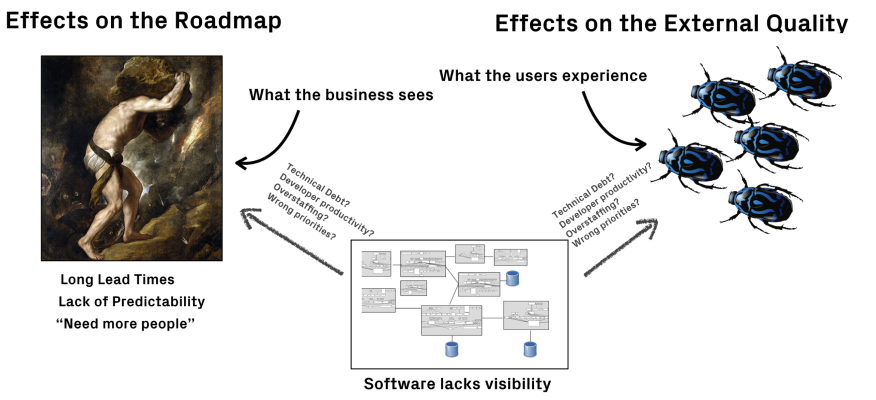
When we accumulate technical debt, experienced developers are typically aware of this. All the business side will see, however, is cards moving across a Jira board. The first signs of trouble tends to be the effects on the product roadmap. Suddenly, features take longer to implement and we tend to lose predictability too; the flow of completed work slows down. The gut response is a cry for more developers, more testers, more of everything.
However, losing predictability during software development is a sure sign that more people isn’t the solution. As I pointed out in Visualize Brooks’s Law: When More People Makes a Late Software Project Later, it might actually worsen the situation. Without clear data and engineering intelligence we simply don’t know. Adding more people is a bet at best, and a dangerous one. Let’s see how to get real data instead by looking at a project facing severe issues.
Case Study: Turning a Crisis into Success
The project had gotten off to a good start, and now the organization decided to scale-up with more developers. However, the existing collaborative strategies were adapted for a small and tight-knit team, and didn’t scale well. As a consequence, the organization soon noticed the familiar set of symptoms indicating deeper problems. The most visible symptom was a surge in the number of support issues. Maybe that could be resolved by hiring more testers or even expand with a first line support?
Unfortunately the problems soon went deeper. After a few fatal sprints where little progress was made, the organization decided to hire even more developers since it had to bring out long-awaited features on the market. The product sponsors were losing trust rapidly.
And this is the point where I got involved. Before deciding on the way forward, management decided to open up the IT blackbox by performing a deeper analysis using CodeScene. I enabled some new CodeScene features that were still under active development but weren’t publicly available yet. Two of the new graphs stood out, and we used these for the initial discussions:

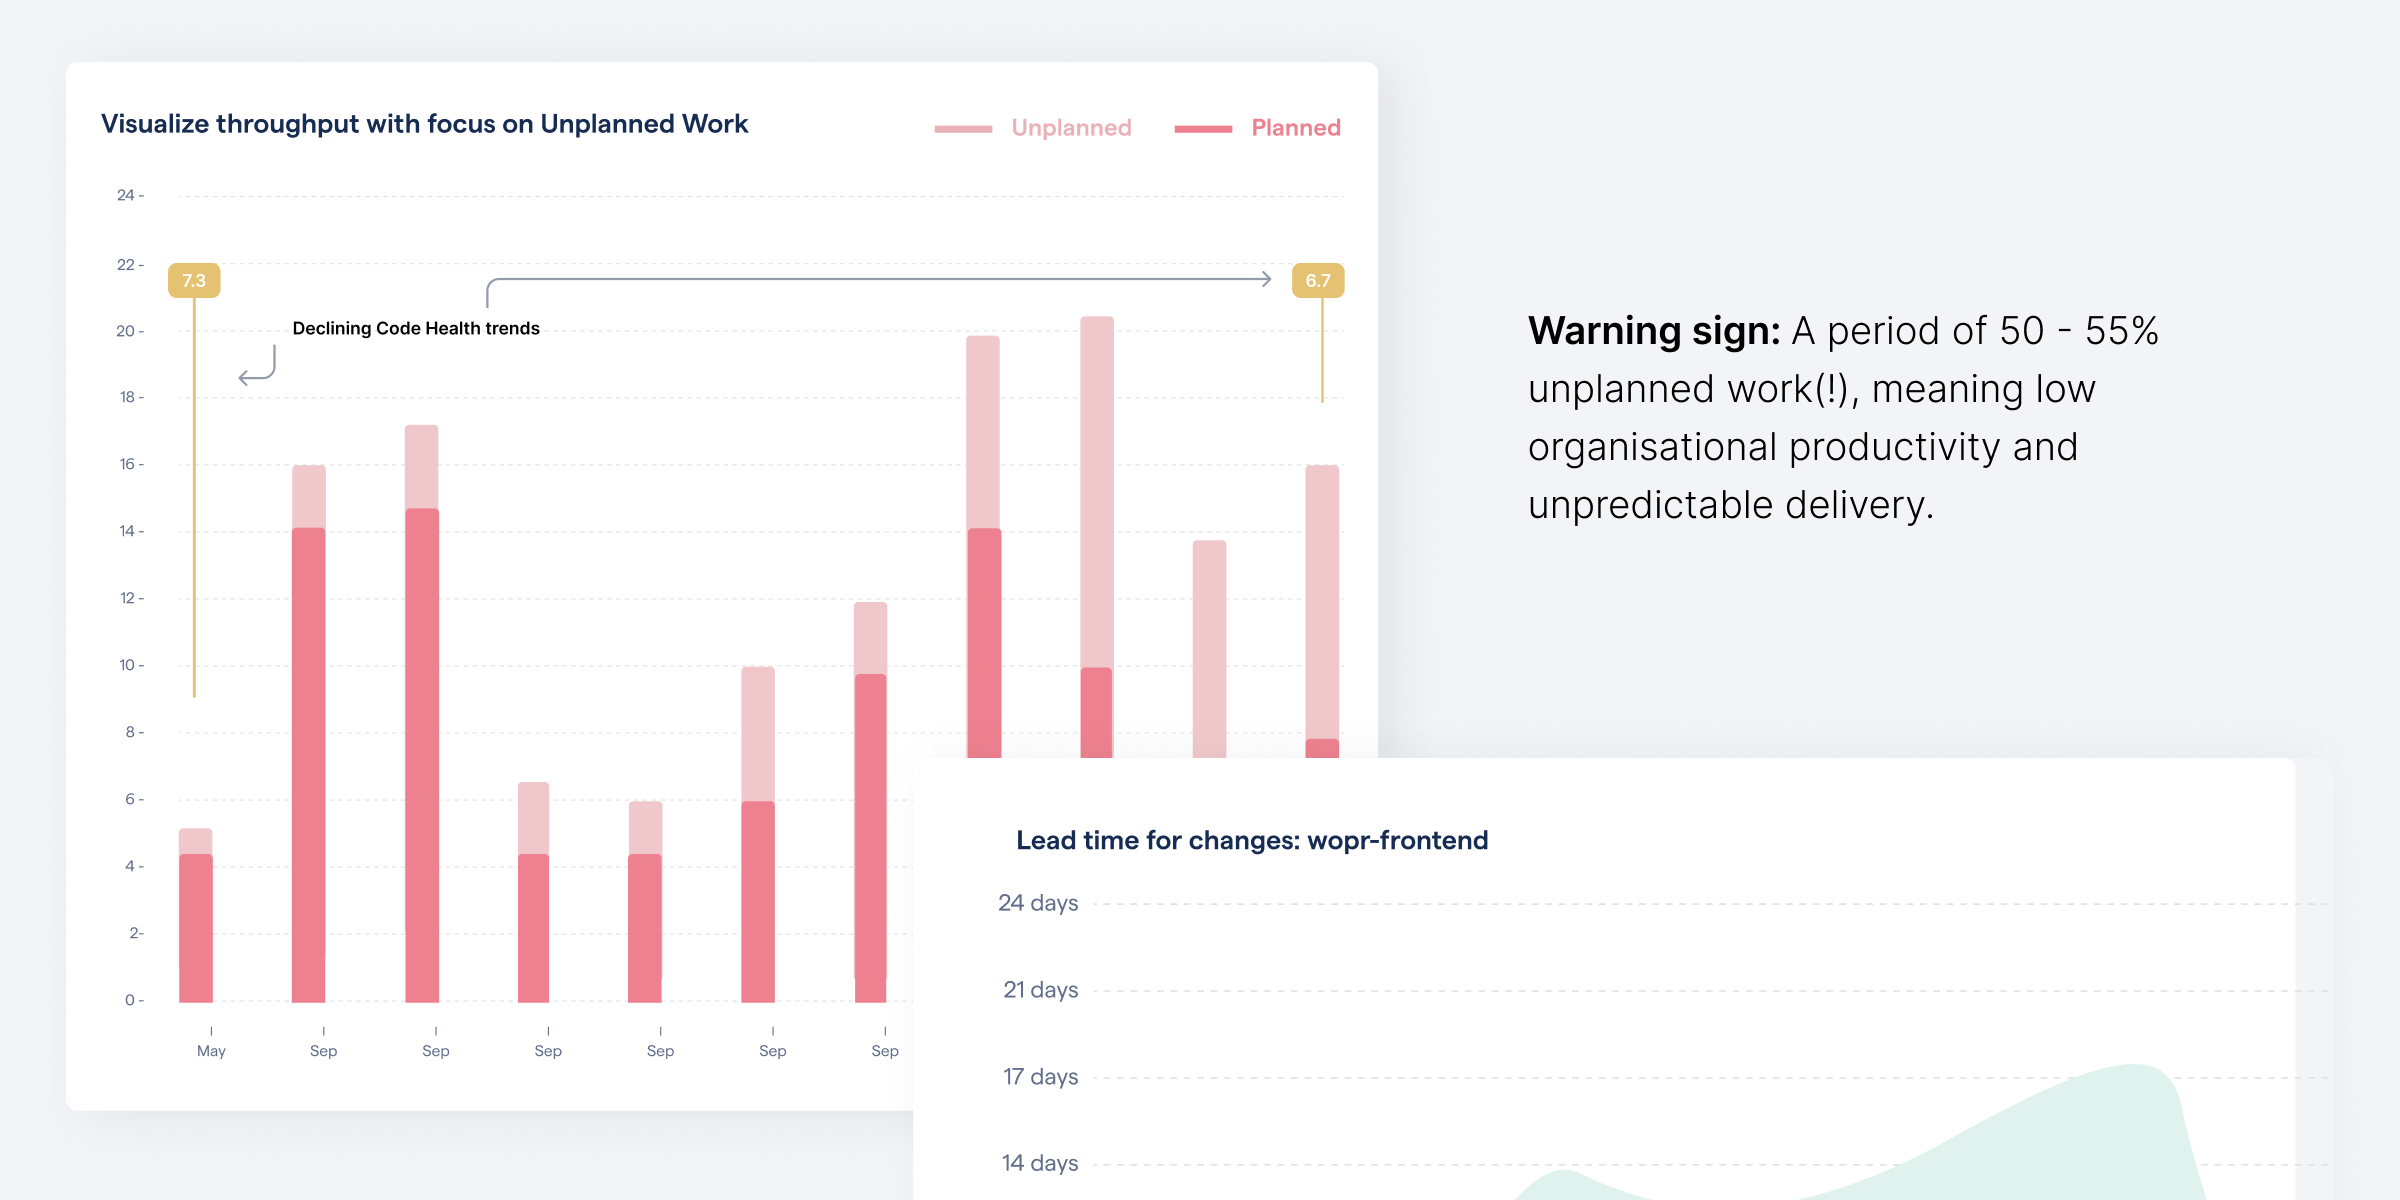
The delivery performance analysis indicates growing problems that impact the business.
- Lead Time for Work Items: The lead time graph shows how much time developers spend working on something before it is released. The graph caught the attention of the product management because, when translated to a business context, the increased lead times mean a longer time to market. The variability in lead times (the shaded, green area in the graph) was also a concern since it indicates low predictability during development or inappropriately scoped work items, often both.
- Throughput in Planned vs Unplanned Work: The graph to the left is even more interesting as it contains the initial hints at what’s actually happening. That graph measures throughput with an emphasize on unplanned work. Now, what’s unplanned work? Typically, everything related to features or improvements is planned, whereas bugs, re-work, and service interruptions are unplanned. Let’s see why unplanned work is relevant.
Dealing with Technical Debt - facing the Silent Killer
Unplanned work steals capacity and leads to inherently unpredictable delivery that turns an organization into a reactive rather than pro-active entity. In fact, in “The Phoenix Project” – a wonderful and highly recommended book – Gene Kim describes unplanned work as “the silent killer” of IT organizations. Minimizing unplanned work is paramount for any IT organization.
When analysing codebases, I rarely start by displaying technical metrics. They are vital for sure, but we first need to put them into a business context. The preceding graphs helped us do just that. I mean, “I want longer time to market with much less predictable costs and delivery” said absolutely zero managers in the history of business. Ever.
Technical debt management by focusing on impact. By communicating the business impact, we now had management’s attention to turn to the root causes and inspect technical trends – such as Code Health Decline – as well as the team structures and architectural alignment. With all stakeholders now sharing the same view of the development work and system health, the organization could conclude that:
- Wasteful Delivery: The additional engineering people they wanted to hire were already on-board. They were just busy reacting to unplanned work due to an increase in the defect rate. If that could be mitigated, the delivery capacity could be doubled without any additional hires!
- Ad-hoc Work: The high amount of unplanned work also meant that the most experienced people were busy doing critical ad-hoc bug fixes rather than driving the product forward or supporting the new team members. This explained why it had become so hard to plan for new features.
- Throughput Decline: Not only do we see a shift towards more unplanned work in the graphs above; the graphs also show that the organization delivers less over time. Part of this efficiency loss was due to the constant context switches required to act on critical support issues.
Based on these findings, product management decided to invest time into managing technical debt in the prioritized hotspots. The initial efforts were measurable already in the first sprint, although the complete turn-around took two months, which is still impressive. During this time, the trends were used to communicate the long-term progress and effects to both engineering and management.

Example on how to visualize the effects of refactoring hotspots, both module- and component-level.
Refactoring at scale is challenging and a significant investment, so communicating the progress is important both from a business perspective but also as a motivational effect to developers. In this case we used a combination of complexity trend visualizations and Code Health Metric as shown in the preceding example.
The organization also had to ensure that the refactored hotspots stayed healthy; we don’t want carefully refactored code to slip back. For that purpose, the organization enabled soft quality gates integrated into existing developer workflows. Finally, more specific improvements were done in re-shaping engineering and collaborative strategies. The outcomes were measured and visualized to ensure there was a real effect:

Visualize measurable improvements in delivery performance.
Just as CodeScene was able to identify alarming patterns before the changes were made so that any new tech debt could be prevented, it was also able to measure the positive effects of the changes. As the preceding graphs show, the amount of unplanned work and the variability of lead times both decreased, resulting in an increased throughput. The improvement is remarkable, and one of the most impressive turn-arounds I have seen. Software doesn’t have to rot.
Unlock the Untapped Potential
In this particular project, the most fascinating outcome was the realization that the badly needed extra capacity already existed within the organization. As you see in the preceding graphs, paying down technical debt in critical hotspots translated into increased throughput and a 50% reduction in unplanned work. This in turn freed time from senior developers who could now contribute to the overall developer productivity through coaching and automation. Translated to the business world, this means lower direct costs in terms of employees, and also lower indirect costs in terms of additional coordination. As a positive side effect, the organization got a motivational boost too. It’s more fun to build something new than panicking over critical bugs.
Again, I won’t claim that CodeScene saved an organization. A tool cannot do that; information is only good when acted upon. However, providing both engineering and management with relevant information and a way forward was a key factor in turning the project around. Ultimately, it’s all about communication.
Inspiration and Tooling
All of these analyses are completely automated, repeatable, and quick. That makes it possible to monitor software development just like we would monitor any other aspects of our system such as performance, page visits, or downtime.
Like most CodeScene metrics, the emphasize in delivery performance is on trends over absolute values. This aligns with what has always been my general recommendation: it’s more important that you – as an organization – move in the desired direction than meeting a specific threshold or number. Metrics are supporting and guiding information, not a replacement for expertise.
Are interested in understanding more about what technical debt is how we can define it? And how do we reduce technical debt? We've got plenty of blog posts for you.
Finally, some closing credits and additional reading recommendations:
- CodeScene’s technical and organization metrics represent the evolution of the ideas in my previous book, Software Design X-Rays.
- The business metrics are inspired by the great work of Dr. Forsgren, Humble, and Kim in Accelerate together with the classic lessons from The Goal by Eliyahu Goldratt.
- Gene Kim’s book The Phoenix Project opened my eyes to the perils of unplanned work in a software context.
Finally, thanks to everyone on Project X and thanks for letting me share your data. You rock!